I thought it would be interesting to compare the methods used to display data in JavaScript debuggers. I surveyed:
I suppose I should test Internet Explorer as well, but I don't think I have the requisite tooling installed to use the debugger (if someone wants to contact me offline about how to set up IE for debugging without having a for-pay version of Visual Studio installed, please do).
I also included Eclipse's Java debugger in the survey.
For the test, I constructed an HTML file with some JavaScript code that created a set of data, and then compared how this data was displayed in the various debuggers.
The data used in the tests was constructed as local variables within a function which was programmatically invoked. Note, this paper includes a link (below) to run the test.
First a set of basic objects is created:
var anInteger = 42;
var aFloat = 6.66;
var aBoolean = true;
var aString = "Lorem ipsum dolor sit amet,..."; // 180 chars total
var aNull = null;
var anUndefined = undefined;
var aNaN = 1/undefined;
var anObject = {x: 5, y: 25};
var aPrintableObject = {x: 5, y: 25};
var aMap = {};
var anArray = [];
var anArguments = arguments;
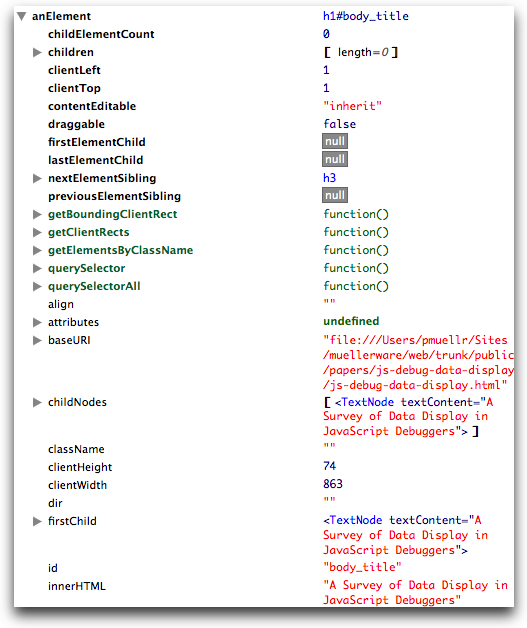
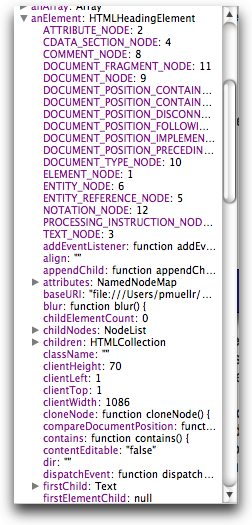
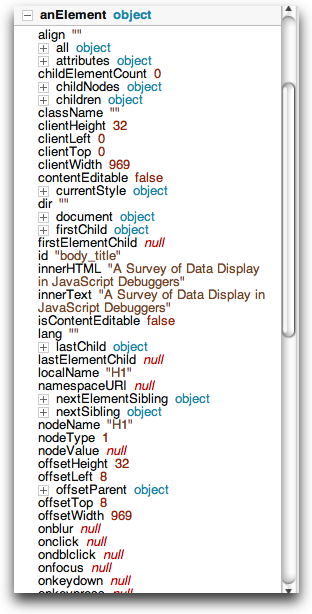
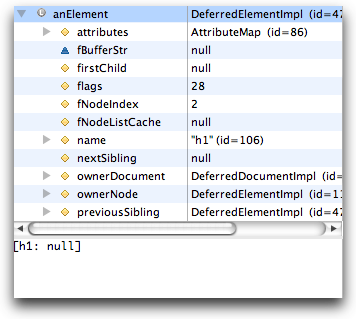
var anElement = document.getElementById("body_title")
Then, the aMap object has a number of properties added; a
property with the name of each of the variables above is added, with the value
being the variable's value. Then, the anArray object has a number
of elements added; each of the variable's value above is added to the list.
The aPrintableObject object is augmented with a
toString() method which displays the values of it's properties.
For Java, a method similar to this function is created as a static
main for a class.
Note that initial attempts at creating recursive versions of
anArray and aMap by adding those objects to
themselves resulted in "odd behavior" in some browsers and even the Eclipse
debugger. This should be further investigated, but for the purposes of this
exercise, the immediately recursive structures were not used.
To run the test yourself, bring up the JavaScript debugger for your
browser, and then
click here. Because there is
a debugger statement in the run() function which is
invoked, you typically won't
need to set a breakpoint to get to the point where all the variables are set,
however, you will likely need to display and/or enable the debugger before
traversing the link.
JavaScript source: test.js
Java source: Test.java
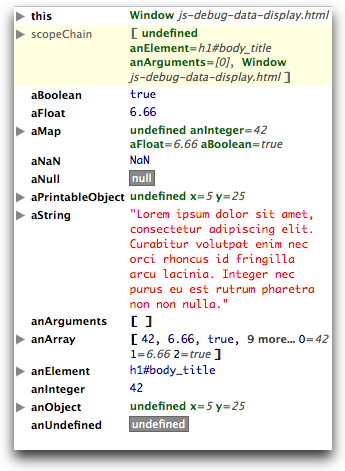
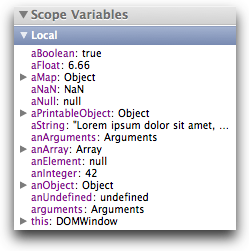
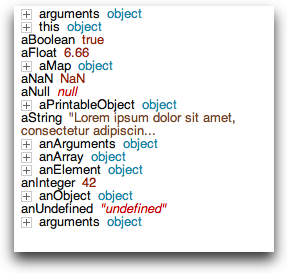
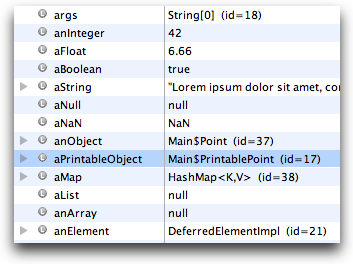
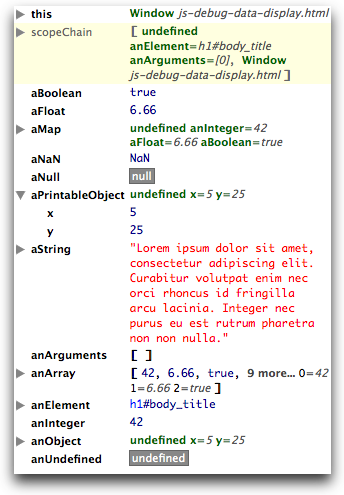
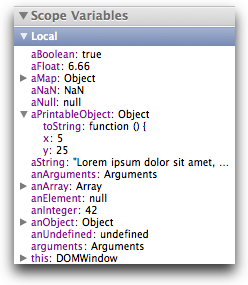
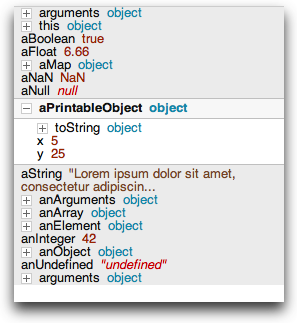
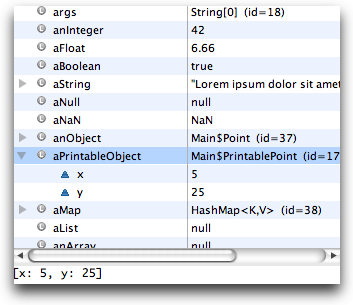
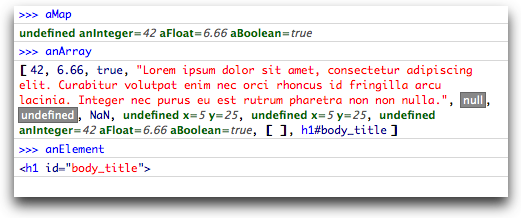
This is the list of variables that the debugger initially displays when it hits the breakpoint.
Notes:
Firebug's list is unusually larger than the others, looks like it could set the line height a bit smaller.
This beta release of Firebug is currently printing the object representation
as undefined. In previous releases, instead of seeing undefined,
you'd see the result of the object's toString() method, or
the name of the object's constructor. Presumably this is a bug in the beta
release which will get fixed eventually.
In addition to the toString() representation, or class
name, Firebug also displays additional information beside a variable.
For instance, the this variable shows the base name of the
url the window is diplaying. For the aMap variable, it shows
some of they key/value pairs in the map.
Although it's not shown here, because it's not the default behavior,
Eclipse can be configured to show the toString() representation
of a value instead of the class name and (useless) id value.
All of the debuggers use trees to display nested structures, using "disclosure triangle" or "squared plus" glyphs. Firebug and Eclipse additionally separate the variables and values, keeping the values left aligned to themselves. We'll see this causes problems later when the nested structures expand and the values need to be shifted to the right.
Dragonfly's "squared plus" glyphs for nested structures align with non-nested property names. Messy.
Firebug and Dragonfly make use of color and font for different
values. Firebug also displays some special values in a "reverse video"
style - null and undefined, but not NaN.
Dragonfly makes no attempt at displaying at least the class name for an object, unlike the other debuggers, it just always displays "object".
Web Inspector and Eclipse only display a small amount of the string. Dragonfly displays a bit more, but it spills into a second line, messily. Firebug displays the entire line. Wonder how long of a string they'll display?
Firebug shows the anArguments variable as an array,
but no structure, and Web Inspector and Dragonfly show it only as an object.
Having both would be nice, in terms of being able to view it as an array,
but also see the properties if expanded.
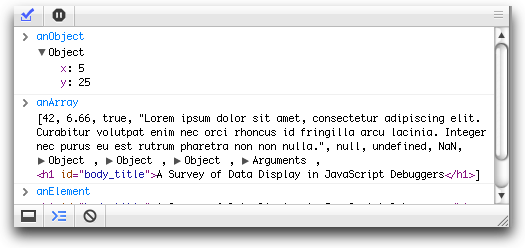
Though it's not displayed, expanding the aMap variable
results in a sublist for each of the debuggers which is similar to this
list itself. For Eclipse, well, let's not go there.
In this set of images, we see the aPrintableObject
expanded.
Firebug does not display the toString() method,
Web Inspector only shows the first line of the function (pretty useless), and
Dragonfly shows it as an object.
Worth nothing again that Firebug would typically display the
result of the toString invocation beside the
aPrintableObject variable, but doesn't for this beta release,
incorrectly showing undefined instead.
We show the additional area below the variable list for
Eclipse in this image. In this case, we see the toString()
representation. And again, Eclipse can be configured to show this in the
variable display, but it's not the default.
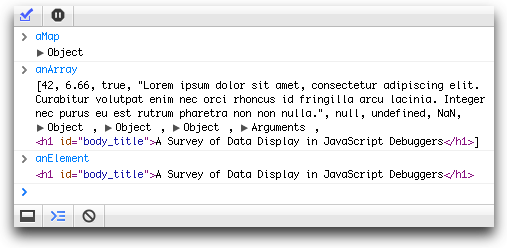
In this set of images, we see the anArray
variable expanded. No big surprises based on anything we've so far.
Except that Web Inspector appears to be sorting the key names
alphabetically, which is confusing.
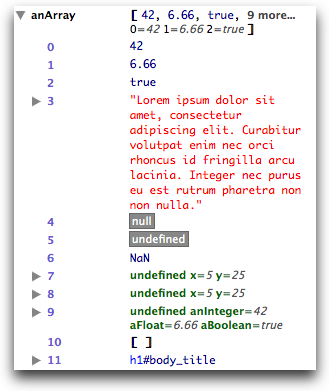
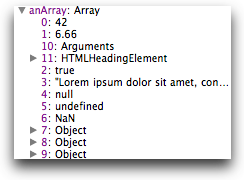
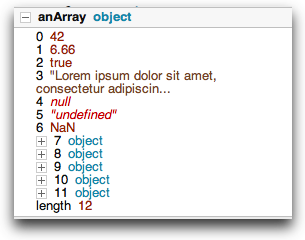
The main point in showing this set of images is to demonstrate how generally useless it is. Rather than display a large number of nested value whose values, it might be nice to optionally filter this list somehow.
The Firebug display has grown significantly wider, presumably to accommodate longer property names after expansion. This is not a good thing.
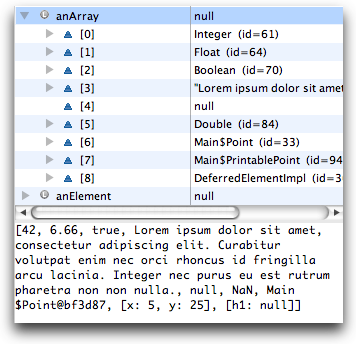
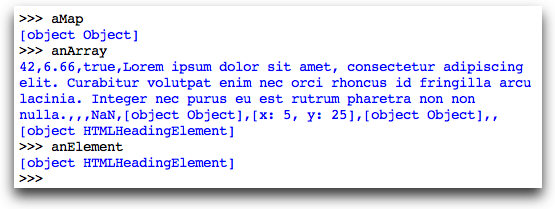
Each of the JavaScript debuggers supports a
REPL
in some form. For this set of images, I sequentially evaluated
the variable names aMap, anArray, and
anElement.
The results are pretty much what we would expect given what we've seen so far, with some surprises.
For Firebug and Web Inspector, when anElement is evaluated by itself, it renders
an HTML source rendition of the element. For Web Inspector, the HTML
source rendition is also displayed for the element within the anArray
variable.
Web Inspector also provides disclosure triangles for nested objects within the console display. The second Web Inspector image shows the result of clicking on a disclosure triangle; the results are displayed inline within the console. Nifty!
As noted, Firebug has a bug or two to work out, but is considered the gold standard of JavaScript debuggers. Primarily because it's the only debugger that developers even realize exist today. But it also currently wins on features alone, including:
toString() representations where appropriate
Dragonfly is the newest of the debuggers, and has some room for growth.
Once some of the styling issues are resolved, it really just needs to add
toString() representations where appropriate.
Web Inspector could make use of styling data types ala Firebug and Dragonfly,
adding toString() representations where appropriate, and it will
then be pretty much up-to-snuff.
General issues concerning all the debuggers is dealing with objects which you'd like to see different representations. Web Inspector and Firebug both display nice renderings of HTML elements, but only in the console. And frankly, this is too browser specific. Need to think wider, as more folks start to look at using JavaScript on the server. How can we accommodate application- or user- specific renderings for objects to make debugging that much nicer of an environment.
One feature I didn't show was Eclipse's
Detail Formatters.
A Detail Formatter provides a runtime override of the toString()
method for a particular class. These are stored persistently in your
workspace, so you don't need to edit them every time.
This feature is nice, as it allows you to extend runtime behavior just while debugging - no code was harmed or edited while debugging. Such a feature would be nice to provide for JavaScript as well.