title should have been filled in via JavaScript
| Author: | Patrick Mueller - [blog] [web] |
| Permalink: | |
| History: |
2010-02-02 - updated Crossfire link 2010-02-01 - initial write-up |
First step
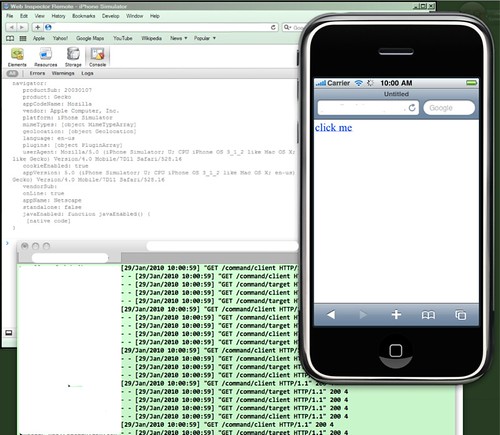
(Note that some areas of the image above have been redacted in white, as they contained host names / ip addresses)
This is a baling-wire-and-duct-tape effort to get a version of the Web Inspector debugger that ships with WebKit to run targeting a remote browser. In this case, an iPhone. Well, the picture shows the iPhone simulator, but this actually runs on my iPod Touch also.
You're looking at three programs running, each potentially on a separate machine:
the debug client - on the upper left is Safari running on Windows (in VNC), loaded with the Web Inspector code running as a "web app"
the debug target - on the right is the iPhone Simulator running as a Mac app, running a very simple page which responds to the "click me" link by writing some text to the console.
the debug agent - on the bottom is a web server running in Python in a green Terminal window that is talking to both of the other programs, acting as a switchboard.
Technically, this effort is less functional that Joe Hewitt's "Firebug for iPhone" code. Namely, the REPL for the console is non-operational; the only thing that works is console.log() invocations being forwarded to Web Inspector's console. (Note however, I wasn't able to get Joe's code linked to in the blog post to run correctly.) The big upside to this hack over "Firebug for iPhone" is that this is running with the current Web Inspector code, unchanged, but with some of "overridden" function added.
Technical Details
Basically what's happening is that the two web apps - the debug target and the debug client - are communicating via XHR to the debug agent, which is a Python program; it's acting as an HTTP server (obviously). When one of the web apps wants to send a message to the other web app, it sends it via XHR to the agent, which forwards it to the other web app.
Both web apps also poll the agent to wait for a command from the other web app. Because I was too lazy to figure out how to run the Python server threaded, this isn't using a "long poll", but a "short/frequent" poll. Survivable, for the moment, but this has to change. You can see the frequent polling in the debug agent Terminal window - each line is the terminal output is an HTTP request.
Also note that the debug agent also serves up the Web Inspector code (HTML/CSS/JS) to the debug client, and so the XHRs between the two are same-origin. However, it's a pain to have the debug target have to use same-origin for the code being debugged (your app), as well as for talking to the debug agent. For this linkage, I took advantage of Mobile Safari's CORS support so the debug agent doesn't have to be same origin as the code being debugged.
This is literally baby steps; there's lots of work to do here.
Digging a little deeper
Debug target
Here's the code which makes up the debug target, which is the code being debugged. Note that the idea here is that this is actually the application being debugged, so I've highlighted the extra code needed to enable the debugging.
<html>
<head>

<script>
RemWiServer = "http://debug-agent-host/" 1
</script>

<script src="json2.js"></script>  2

<script src="http://debug-agent-host/remwi-common.js"></script>  3
<script src="http://debug-agent-host/remwi-target.js"></script>

<script>
function dumpObject(name, object) {

    var output = name + ":\n"
    for (var key in object) {
        output += "   " + key + ": " + object[key] + "\n"
    }
    return output + "\n"
}

function whenClicked() {
    console.log("the link was clicked at " + new Date())  4
    console.log(dumpObject("navigator", navigator))
    console.log(dumpObject("screen", screen))
}
</script>

<style>
@media only screen and (max-device-width: 480px) {
body {
    font-size: 400%;
}
}

</style>

</head>
<body>
<a href="javascript:whenClicked()">click me</a>
</body>
</html>
Notes on the highlighted lines above:
1 - This line sets the base URL for the debug agent, used by the code in the remwi-*.js files.
2 - Mobile Safari doesn't include the JSON object! And my code makes use of JSON, so I pulled in Crockford's version.
3 - These contain the code which provides the linkages to the debug agent; the remwi-common.js file contains code used by both the debug target (this file) and the debug client.
4 - The lines make calls to the standard console.log() function, which in this case is overridden by the remwi-target.js file.
Debug client
The debug client is literally the Web Inspector code as shipped with WebKit nightlies, with some additional scripts added to override bits of functionality here and there.
Because Web Inspector needs to support Chrome's multi-process architecture, it turns out that a lot of the interaction between the debug client and the target has been spec'd out as a set of functional interfaces. Which makes an effort like this a lot easier.
What else can we conceivably do?
Since we've got the Web Inspector code running, kind of, it's easy to look at the function it provides and wonder about how we could get that to work with this technique. Let's go panel-by-panel:
Elements
I'm unfamiliar with how this pane is populated by Web Inspector today; it may be too slow to rely on the existing JavaScript engine to gather all the information for this pane. But that would be true for big web apps, maybe it would be ok to do this in user-space for smaller apps, like something running on a mobile device.
Resources
Resources are a bit of a problem, since JavaScript generally has no knowledge of other resources being loaded. This can be solved by proxying your entire app through the debug agent. Then the debug agent can capture which resources are being accessed, when they were loaded, how long it took to load them, etc. The proxy could be a simple proxy for a specific app, so you would always debug your app by targetting the debug agent as the opening page, or could be a general HTTP proxy set up at the device level.
Storage
At least some bits of the Storage pane seem possible to implement, but will require overriding the existing APIs. For instance, for the SQL databases, there's no API to determine the name of the databases being used. The existing APIs could be wrappered so that you could at least get the names of the databases your code is accessing.
Console
The first bit of Console is already proven here. The REPL needs to be added. The console also catches messages from WebKit that users don't typically see and aren't available via any existing JavaScript API. Eventually, will be nice to have these also.
What can't we do?
Here's the panel-by-panel breakdown of what we can't easily do with this technique:
Scripts
This is the JavaScript source-level debugging pane, where you can set breakpoints, etc in your JavaScript source. Supporting this will be impossible with the user-land debug story, as JavaScript debug APIs aren't available to web applications. Actually, there aren't any debug APIs at all for JavaScriptCore.
Timeline
Timeline provides low-level eventing information, for example, when painting events occur. Since this level of information isn't available to user-land JavaScript, we'd need some new public APIs for this.
But see below for thoughts on instrumenting existing libraries to generate some Timeline-ish information.
Profiles
Profiling JavaScript code seems right out, with user-land code, but see below for thoughts on instrumenting code to generate data for the Profiles panel.
Other ideas
APIs for source-level JavaScript debug
The lack of source-level JavaScript debug (see above) is very sad, especially since both FireBug and Web Inspector provide pretty good capabilities there. In my mind, these sort of APIs need to be made available, so that we can write source-level debuggers in JavaScript. Presumably standardized as part of ECMAScript.
In case you're wondering how you would write a source-level debugger for JavaScript in JavaScript:
- see Smalltalk
- probably involves Workers
Function/Class/Module-level debugging for JavaScript
Source-level debugging for JavaScript is hard without real APIs, but you can do some interesting things if you know about the structure of your code. For instance, see "who called that function?" and "JavaScript tracing".
So while you might not be able to step through lines of a function, you could probably have breakpoints just before a function is called, and just after it returns (or throws an exception). Might be good enough.
You could also perhaps generate some information that could be used by the Profiles pane.
It's not a stretch to imagine library-specific extensions for debuggers; libraries/frameworks like Dojo, Closure, and CommonJS seem like they'd be amenable, technically, to being instrumented to provide information to the debugger. They could, for instance, provide the list of class/modules loaded, the relationships between the classes/modules, the contents of them, etc.
Many of these libraries also provide various eventing capabilities, which could also be instrumented to provide information like the Timeline panel does.
End goal
At the end of the day, you don't want to have to run something like the debug agent I've written, nor do you want to have Web Inspector running as a web page, since it already runs fine within WebKit-enabled browsers. The debug agent needs to be embedded into WebKit, and the current Web Inspector needs to become able to connect to (or accept connections from) a remote browser.
One thing I'm thinking of doing is rewriting the debug agent using node.js. If we have to add more code to WebKit, then I'd like for it to be JavaScript code instead of C++ code, so that would be a step in the right direction.
Presumably, if this is all in WebKit, all of the panels, including the Scripts panel, can be supported, for any debug targets that include the relevant support.